
The duty point on a pump datasheet is what you asked for. The flow the pump actually delivers is wherever its head-flow curve crosses the system curve of the pipework it is connected to. If the system is more restrictive than you assumed, the pump runs back along its curve. If it's less, the pump runs out.
The Piping Systems module in EngCoSuite finds that crossing point for you.
Enter the curve, then calculate
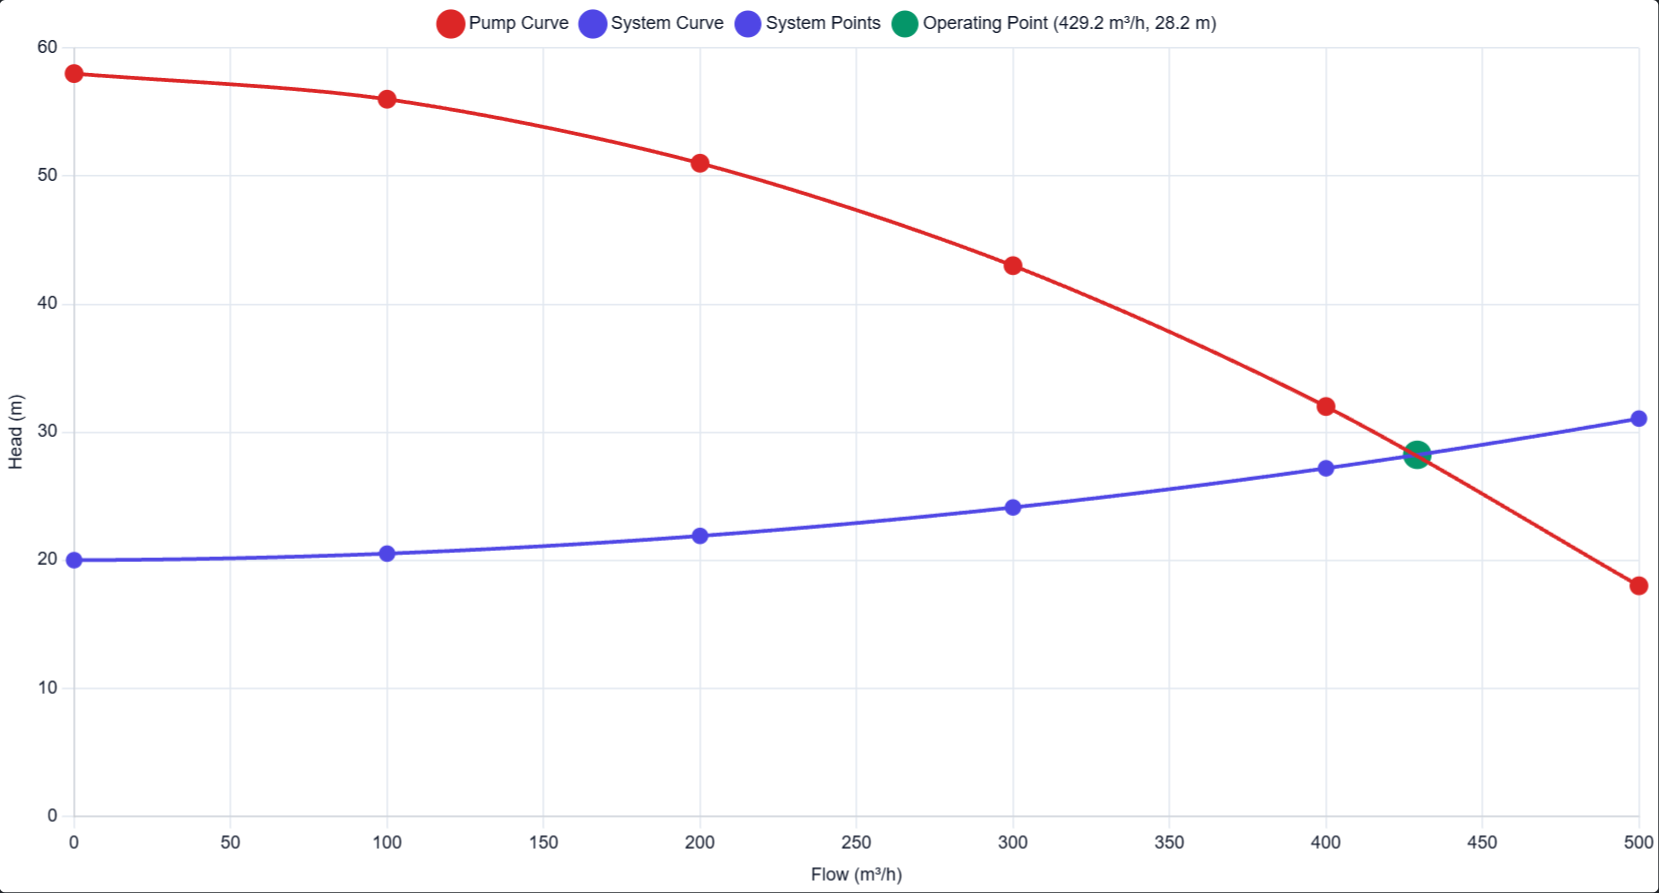
You draw the system the way it is: tanks, a pump, a header, pipes with their fittings. For the pump you enter the head and flow points from the vendor curve. In my demo the pump runs from 58 m at zero flow down to 18 m at 500 m3/h, in six points.
Click Calculate and EngCoSuite does the following:
- It runs the system at a series of flow points up to the pump's maximum flow, using the friction and fitting losses of your actual pipework and the static head between the tanks.
- It fits a curve through those points (a polynomial of degree 1 to 3).
- It searches for the flow where the pump head equals the system head, which is the operating point.
On the demo water transfer line, the system curve starts at 20 m of static head. It crosses the pump curve at 429 m3/h and 28.2 m.
The awkward cases
Real pump stations aren't one fixed-speed pump on one curve, so the same model handles more:
- Variable speed. Give the pump a reference speed and a speed range and EngCoSuite applies the affinity laws (flow with speed, head with speed squared, power with speed cubed) and solves for the speed.
- More than one pump. Add several pumps, each with its own curves. Series and parallel arrangements combine the curves (parallel adds flow, series adds head) and the operating point is split back to each pump.
- One curve per scenario. A scenario can point to a different pump curve, so Normal and Peak demand don't have to share the same one. A pump can hold several named curves, and each scenario picks the one it uses.
- Valves that open and close. On/off valves and fittings can be open or closed per scenario, so you can see what happens when one branch is isolated.
See where the pressure goes
The hydraulic grade line is drawn for each branch in the report and the viewer. It starts at the water surface of the tanks, steps up across the pump, and falls with friction along each pipe.
A report to hand over
The report and PDF include the system summary, a pipe table per scenario (flow, velocity, Reynolds number, friction factor, fitting, elevation and orifice losses), the pump operating point, the system curve chart, a comparison across scenarios, and the grade line diagrams. All values are shown to four decimal places.
Assumptions
The solver is steady state and treats the fluid as incompressible water at 1000 kg/m3 and 1 cP. It's the right tool for clean water systems, and not for slurries, where the head and friction need correcting for solids.
Over to you
Do you check the operating point at minimum flow as well as at duty?