
Cloud Process Flow Diagrams
Create professional PFDs with a built-in calculation engine. Drag, drop, connect, and compute — all in your browser.
Overview
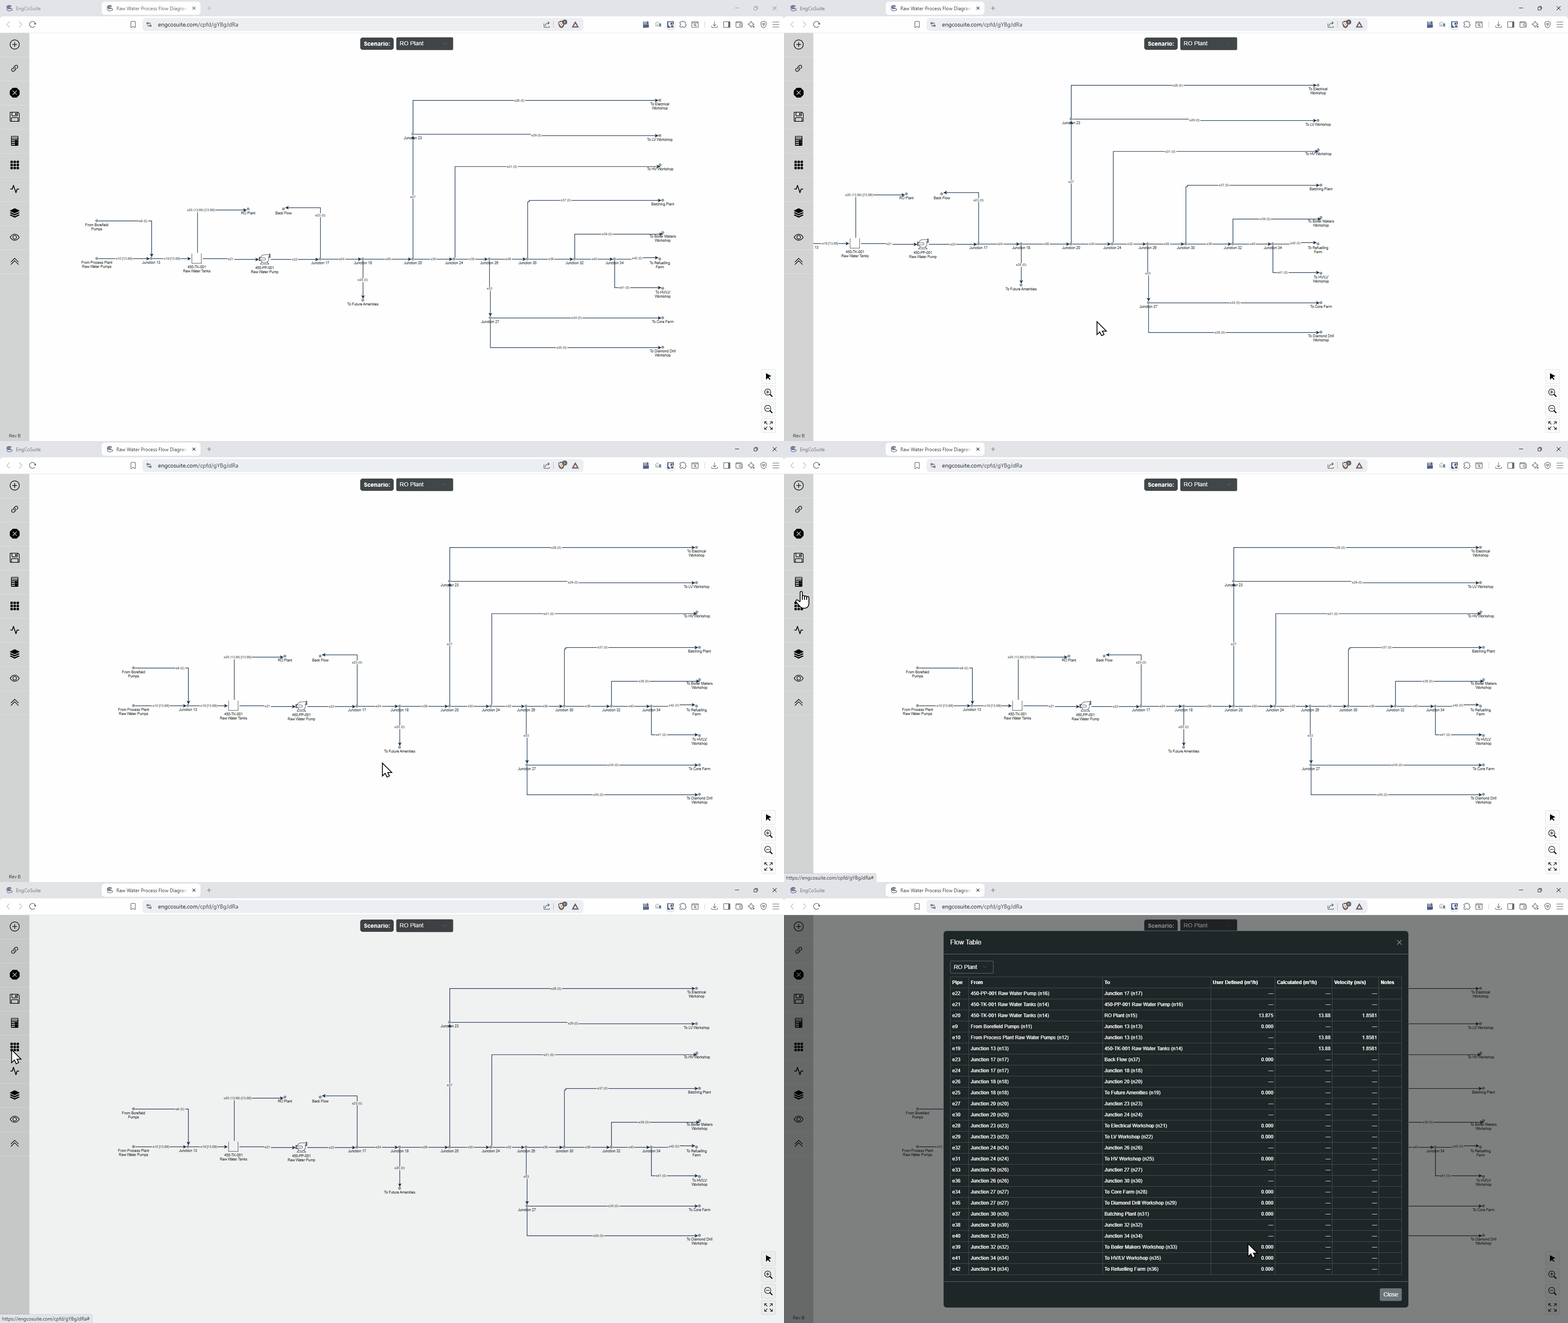
Cloud Process Flow Diagram (CPFD) is more than a drawing tool — it's a calculable process flow network. Model equipment (tanks, pumps, vessels) connected by pipes, assign flow rates and slurry properties, then run a server-side calculation engine that computes flow balances, slurry specific gravities, solids mass flow rates, and pipe velocities across the entire network.
Compare scenarios side by side, generate professional PDF reports with embedded system diagrams, and share results via secure viewer links.
Key Features
Visual Diagramming
Drag-and-drop canvas with node types: Tank, Pond, Pressure Vessel, Junction, Pump, Thickener. Manhattan-routed edges with customizable waypoints and labels.
Calculation Engine
Server-side flow balance solver. Propagates flows root-to-leaf, verifies mass conservation at every node, and computes slurry specific gravity and solids mass flow.
Multi-Scenario Modeling
Create named scenarios — Normal Operation, Peak Flow, Maintenance — on the same topology. Independent flow values per scenario with cross-scenario comparison table.
Slurry & Solids Balance
Automatic slurry state propagation through the network. Solids mass flow calculation with per-node balance verification and delta highlighting.
PDF Reports
Multi-section PDF: cover page with revision history, per-scenario body with embedded system diagrams and result tables, cross-scenario pipe summary. DomPDF + FPDI merge.
Interactive Report
Browser-based report with scenario tabs, embedded SVG system diagrams, node and pipe input tables, computed results, and mass balance verification.
How It Works
Draw Your Network
Place equipment nodes on the canvas and connect them with pipe edges. Set flow rates, pipe diameters, and slurry properties for each scenario.
Calculate
Click Calculate. The engine solves flow distribution, mass balance, slurry propagation, and velocity across the network. Results appear instantly on each edge.
Report & Share
View the interactive report, export to PDF with embedded diagrams, or share a read-only viewer link. All work is revision-controlled and saved automatically.
Calculation Engine
The server-side engine performs graph-theory-based flow analysis on your process network:
- Flow distribution: Root-to-leaf propagation with bottom-up balance iteration
- Cycle detection: DFS-based — cycles rejected unless they pass through a pump
- Mass conservation: Per-node flow and solids balance with delta highlighting
- Slurry SG:
SG = 1 / (frac/SG_solid + (1-frac)) - Velocity:
v = (Q/3600) / (π·d²/4) - PDF pipeline: Browser diagram capture → PNG → DomPDF cover/body/summary → FPDI merge
Ready to Get Started?
Create your first process flow diagram in minutes — no software to install.
Sign Up Free